Environmental Research Letters 4 (October-December 2009) 044008
doi:10.1088/1748-9326/4/4/044008
J G Titus1, D E Hudgens2, D L Trescott3, M Craghan4, W H Nuckols5, C H Hershner6, J M Kassakian2, C J Linn7, P G Merritt8, T M McCue9, J F O'Connell10,13, J Tanski11 and J Wang12
1 US Environmental Protection Agency, Washington, DC 20460,
USA
2 Industrial Economics, Incorporated, 2067 Massachusetts Avenue, Cambridge, MA
02140,
USA
3 Southwest Florida Regional Planning Council, 1926 Victoria Avenue, Fort Myers, FL
33901,
USA
4 Middle Atlantic Center for Geography and Environmental Studies, Manasquan, NJ
08736,
USA
5 W H Nuckols Consulting, 531 Sunset Road, Annapolis, MD 21403,
USA
6 Virginia Institute of Marine Science, Gloucester Point, VA 23062,
USA
7 Delaware Valley Regional Planning Commission, 190 North Independence Mall West,
Philadelphia, PA 19106-1520,
USA
8 Treasure Coast Regional Planning Council, 421 SW Camden Avenue, Stuart, FL
34994,
USA
9 East Central Florida Regional Planning Council, 631 North Wymore Road Suite 100,
Maitland, FL 32751,
USA
10 Woods Hole Oceanographic Institution, Sea Grant Program, Woods Hole, MA
02543,
USA
11 New York Sea Grant Program, 146 Suffolk Hall, Stony Brook University, Stony Brook,
NY 11794-5002,
USA
12 Pyramid Systems, Incorporated, 9302 Lee Highway, Fairfax, VA 22031,
USA
13 Current address: University of Hawaii, Sea Grant College Program, Honolulu, HI 96822, USA
Received 7 April 2009
Accepted 7 July 2009
Published 27 October 2009
| Abstract. Rising sea level threatens existing coastal wetlands. Overall ecosystems could often survive by migrating inland, if adjacent lands remained vacant. On the basis of 131 state and local land use plans, we estimate that almost 60% of the land below 1 m along the US Atlantic coast is expected to be developed and thus unavailable for the inland migration of wetlands. Less than 10% of the land below 1 m has been set aside for conservation. Environmental regulators routinely grant permits for shore protection structures (which block wetland migration) on the basis of a federal finding that these structures have no cumulative environmental impact. Our results suggest that shore protection does have a cumulative impact. If sea level rise is taken into account, wetland policies that previously seemed to comply with federal law probably violate the Clean Water Act. |
Keywords: climate change, adaptation, land use planning, sea level rise, wetland migration, shore protection
Contents
1. Introduction
Changing climate is expected to cause global sea level to rise approximately 20–60 cm during the 21st century if polar ice sheets remain stable [1] but possibly more than 1 m if ice sheets become unstable [2]. Rising sea level inundates low-lying lands, erodes shorelines [3, 4] exacerbates coastal flooding [4, 5] and increases salinity in estuaries [4, 6, 7] and aquifers [6, 8, 9].
Site-specific responses to sea level rise are broadly classified into two pathways: shore protection and retreat [10]. Shore protection (e.g. bulkheads, dikes, beachfill) can minimize disruptions to coastal communities from floods and shore erosion, but it prevents the inland migration of coastal ecosystems, which are instead squeezed between the rising sea and bulkheads built to protect the communities [4, 11–13]. Retreat (e.g. prohibiting or removing hazardous construction) can allow ecosystems to migrate inland [10, 14], but land and structures can be lost [12]. The resulting disruption can be minimal in undeveloped areas [10, 12] but potentially severe in populated areas, especially if retreat occurs after shore protection fails during a storm [15].
Property owners and land use agencies have generally not decided how they will respond to sea level rise, nor have they prepared maps delineating where shore protection and retreat are likely [10]. The absence of such maps prevents a realistic assessment of the consequences of rising sea level, and can impair efforts to prepare for those consequences [10]. For example, the Clean Water Act allows the US Army Corps of Engineers to routinely issue permits for a class of activities, provided that the activities do not have a cumulative environmental impact [16]. The Corps has issued a regulatory finding that shore protection will not have a cumulative impact [17] and used it to justify a policy under which property owners are routinely granted permits to build bulkheads [18]. Yet no one has estimated (and the regulatory finding did not consider) the portion of coast likely to be bulkheaded as sea level rises [10, 19].
This letter maps and quantifies a baseline, business-as-usual scenario of coastal development and shore protection for the Atlantic coast of the United States from Massachusetts to Florida. Taken together, land use plans, existing land use, regulations, and shore protection policies can provide a baseline expectation regarding the composition of future shore protection and retreat. With this analysis, planners from the local to national level can assess the extent to which coastal wetlands might migrate inland or be lost (and identify infrastructure that would eventually require remedial attention) and then evaluate other options. The following sections describe methods, results, and some implications for policies to protect coastal wetlands; additional methods, tables, and maps are in the supplementary material. Although this letter provides summary maps and tables, we are also making our results available as shapefiles and raster data sets with a 30 m grid suitable for ArcGIS and other geographical information systems software [20].
2. Methods
With the assistance of local planners responsible for land use in 131 jurisdictions from Massachusetts to Florida (table S1), we used available planning data (tables S2 and S3) and identified relevant government policies (tables S4 and S5) to divide coastal dry lands into four categories representing different likelihoods of shore protection. We used wetlands data (table S6) to distinguish dry lands from wetlands, and made no attempt to account for future development in wetlands. Our initial classification focused on land use. Developed lands have generally been protected in the past when threatened by erosion or flooding [12, 13]; hence they are most likely to be protected in the future [10, 21]. At the other extreme, conservation lands are generally allowed to respond naturally to shore processes [22] and hence are least likely to be protected [10]. We used available land use/land cover data for moderate and high-density development to define developed, and conservation lands data sets to define conservation (table S2).
We divided the remaining dry lands into two categories: areas expected to remain undeveloped and an intermediate category consisting of existing low-density development, places where land use plans anticipate future development, and military bases in rural areas. Undeveloped lands are rarely protected [10]; but even lightly developed lands are generally protected along estuaries [13], which account for most of the shoreline along the US Atlantic coast. Hence, under current policies, shore protection is more likely in intermediate lands but less likely in undeveloped lands [10]. In urban counties and other places where near-total development is expected, we used parks and agricultural-preservation data to identify the relatively few lands unlikely to be developed (table S2). In rural areas, state or local planning documents identify lands where development is expected.
With our classification of coastal land use as a starting point, we then visited the local planners to further refine the maps. The planners indicated that our four land use categories generally correspond to the land that is most likely, likely, unlikely, or least likely to be protected as sea level rises (assuming a continuation of current policies and practices). Given that correspondence, our tables and figures 1 and 2 have land use labels instead of likelihood labels so that our primary source of information is more transparent. (The supplementary information provides additional detail and caveats on this issue, as well as descriptions of the data, study area boundaries, and GIS processing methods.) We created county-specific maps for the land within approximately 5 m above spring high water, which we sent to the planners for additional refinements (except for Florida, whose local governments only provided land use data below the USGS 3 m contour). We also calculated the area of each land category at various elevations between 0 and 5 m above spring high water.
The planners provided us with four types of refinements.
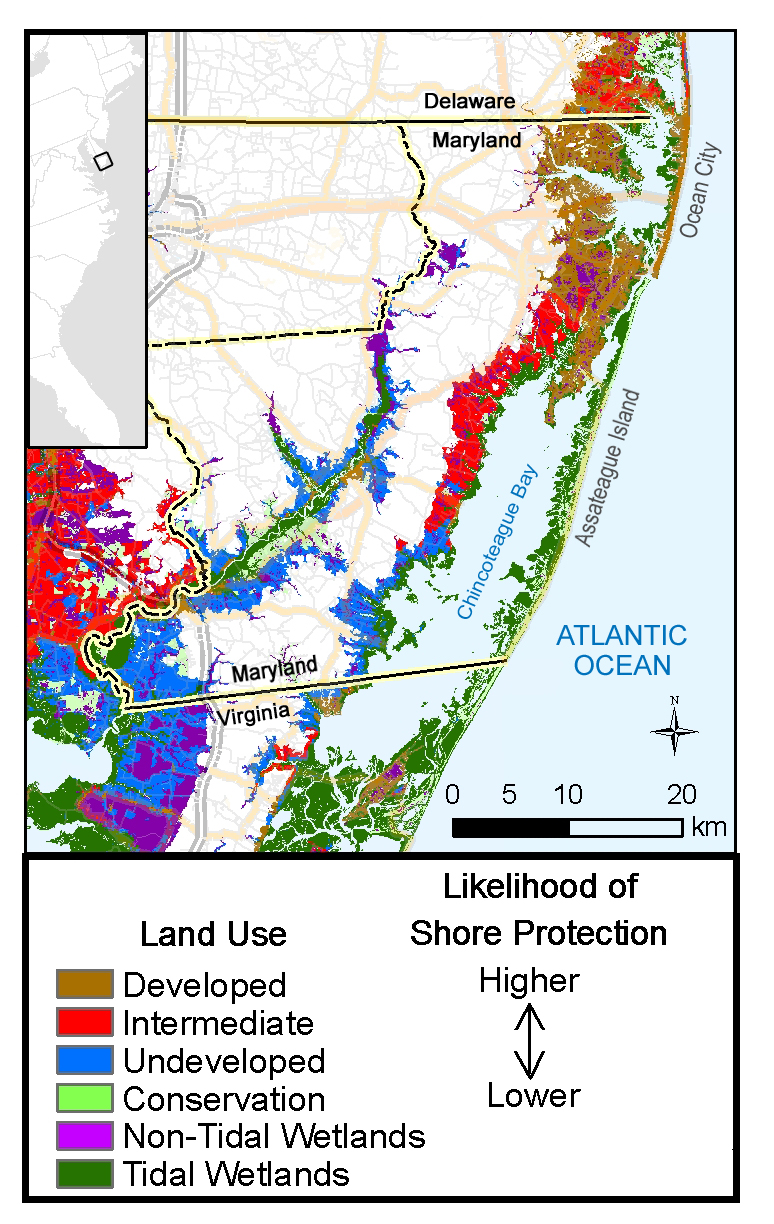
Figure 1 maps the four land classifications (as well as wetlands) for an example county in Maryland.
|
|
Figure 1. Land use and likelihood of shore protection along the Maryland coast. This map shows lands within 5 m above spring high water. Along the Atlantic Ocean, Ocean City is densely developed and the state government is committed to shore protection, while Assateague Island is owned by the National Park Service, which is committed to allowing natural shoreline processes to operate in conservation lands. Along the coastal bays, the northern areas opposite Ocean City are developed with many shores already bulkheaded. The southern areas along Chincoteague Bay shown in blue are generally farms with agricultural-preservation easements that prevent residential development; although the easements allow shore protection, farmers in this area have rarely erected bulkheads in the past. The land use plan shows future development for most of the area shown in red. |
Limitations in available data almost certainly cause our results to understate the level of existing and future development. Most land use data are 5–10 years old and thus omit recent development. More importantly, rural land use plans identify priority growth areas where local governments are encouraging development to concentrate, but not all areas where development will eventually occur. Development often takes place in other areas, especially once the priority areas have been developed.
3. Results and implications
Most of the ocean coast is developed or intermediate, but conservation lands account for most of the Virginia ocean coast, and large parts in Massachusetts, North Carolina, and Georgia. Figure 2 shows the entire study area; figures S2–S23 show specific counties and/or states. Measured by area, more than 80% of the land below 1 m in Florida or north of Delaware is developed or intermediate (tables 1 and S8 ). Only 45% of the land from Georgia to Delaware is developed or intermediate, by contrast, because Maryland and Delaware restrict coastal development (table S4 ) and most coastal lands from Virginia to Georgia are farther from major population centers.

| Figure 2. Categories of land use and likelihood of shore protection along the Atlantic coast of the United States. Coastal development is most intense north of Delaware Bay, in Florida, and elsewhere close to metropolitan areas such as Washington, Norfolk, and Charleston. The study area is generally the land within 5 m above spring high water, except for Florida where planning departments provided data for lands below the USGS 3 m contour. |
| Table 1. Land within 1 m above high water by intensity of development along US Atlantic coast. |
| Likelihood of shore protection | |||||||
| High<-------------------------------------------------------------->Low | |||||||
| Per cent of dry land, by land use typea | Area | ||||||
| State | Developed (%) |
Intermediate (%) |
Undeveloped (%) |
Conservation (%) |
Dry land (km2) |
Nontidal wetlands (km2) |
Tidal wetlands (km2) |
| MA | 26 | 29 | 22 | 23 | 110 | 24 | 325 |
| RI | 36 | 11 | 48 | 5 | 8 | 1 | 29 |
| CT | 80 | 8 | 7 | 5 | 30 | 2 | 74 |
| NY | 73 | 18 | 4 | 6 | 165 | 10 | 149 |
| NJ | 66 | 15 | 12 | 7 | 275 | 172 | 980 |
| PA | 49 | 21 | 26 | 4 | 24 | 3 | 6 |
| DE | 27 | 26 | 23 | 24 | 126 | 32 | 357 |
| MD | 19 | 16 | 56 | 9 | 449 | 122 | 1116 |
| DC | 82 | 5 | 14 | 0 | 4 | 0 | 1 |
| VA | 39 | 22 | 32 | 7 | 365 | 148 | 1619 |
| NC | 28 | 14 | 55 | 3 | 1362 | 3050 | 1272 |
| SC | 28 | 21 | 41 | 10 | 341 | 272 | 2229 |
| GA | 27 | 16 | 23 | 34 | 133 | 349 | 1511 |
| FL | 65 | 10 | 12 | 13 | 1286 | 2125 | 3213 |
| Total | 42 | 15 | 33 | 9 | 4665 | 6314 | 12 882 |
| a Calculated as the statewide area of a given land use category divided by the area of dry land in the study area. Percentages may not add up to 100% due to rounding. |
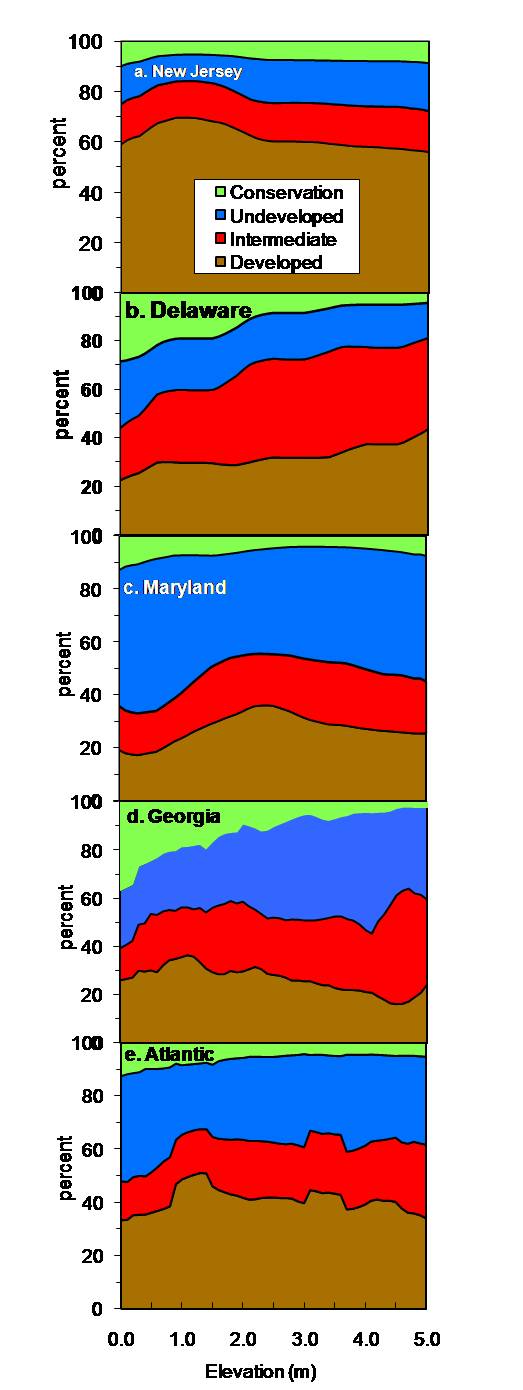
The composition of the four land categories shifts modestly as a function of elevation (figure 3). The percentage of conservation lands declines with increasing elevation in 10 states and is relatively constant in the other 4 states (figure S2). The concentration of conservation lands at the lowest elevations is consistent with the acquisition priorities of the national refuge system and other conservation organizations. Many refuges include habitat immediately along estuaries, but do not extend far inland [23]. The proportion of undeveloped land is also greater at the lowest elevations, especially in Delaware (where two counties prohibit development in floodplains) and Maryland (where state law prevents development within 300 m of the shore in rural areas). New Jersey is an exception to the general pattern, possibly because all but one of its barrier islands are developed, and the past practice of filling marshes for development [24] has created a legacy of very low-lying development.
|
Figure 3. Percentage of dry land within four land use classifications, by elevation. In most states the portion of conservation and undeveloped lands is greatest below 1 m and gradually tapers off at higher elevations, because nature reserves include low land adjacent to wetlands and development is discouraged in floodplains. (a) New Jersey is an exception, primarily because the densely developed coastal communities tend to be in areas with the greatest amount of very low land, such as barrier islands and filled wetlands. (b) Delaware, (c) Maryland and (d) Georgia all follow the typical pattern. (e) Atlanticwide, the portion of developed land decreases above 1.5 m largely because Florida (which is highly developed) accounts for about 35% of the dry land below 1.5 m but only 15% of the dry land above 1.5 m. |
Considering our entire study area, 42% of the dry land within 1 m above the tidal wetlands is developed and most likely to be protected given business-as-usual (table 1). Some development either exists or is expected in the land use plans for another 15% of the area. Thus, almost 60% of the lowest dry land is likely to be developed and eventually protected as sea level rises. By contrast, only 9% of this land has been set aside for conservation purposes that would allow coastal ecosystems to migrate inland. Land use plans do not anticipate development of the remaining 33%, which is mostly rural today. Eventually, some of those areas may be developed as well, especially from Virginia to Georgia, where there are few institutional limitations on coastal development.
Our results suggest that the majority of low-lying lands along the US Atlantic coast will become populated if business-as-usual development continues. Maintaining this development as sea level rises would require increasingly ambitious shore protection [10]. The US experience protecting populated areas below sea level from flooding is mostly limited to metropolitan New Orleans [15]. Sea level rise could leave communities similarly vulnerable throughout the US Atlantic coast.
The resulting shore protection could imperil a key environmental objective in the United States: the preservation of tidal wetlands. In the 1970s, the United States collectively decided to stop creating new coastal communities by filling marshes and swamps [25, 26], and enacted other policies [13, 19, 26–28] to preserve tidal wetlands along the Atlantic coast. But these ecosystems may not be sustained if sea level accelerates. At the current rate of sea level rise, most tidal wetlands are able to keep pace through sedimentation and peat formation; but their ability to keep pace with a rate greater than 5–10 mm yr–1 is doubtful [10]. To survive, these ecosystems would have to migrate inland [4, 10, 11]. With only 9% of the lowest land set aside for conservation, a large-scale migration would require either a halt to construction in most coastal floodplains or an eventual abandonment of many developed areas [10, 19]. But current policies promote the opposite [10].
The existing nationwide permit for shore protection [18] authorizes almost any owner of a small- or medium-sized lot to erect a shore protection structure that prevents ecosystems from migrating inland. The Clean Water Act allows this type of general permit only if it has a minimal cumulative environmental impact [16]. The Corps of Engineers found that the impact is minimal, based on the assumption that building a shore protection structure threatens an area of habitat equal to the footprint of the construction, but that no additional habitat is lost over time [17, 29]. Ignoring the habitat eventually lost by blocking wetland migration is unreasonable, in our view, because preventing the landward migration of aquatic habitat (wetlands, beaches, floodplains, and shallow waters) onto the land being protected is the main reason for shore protection [13, 29]. The Corps should re-evaluate its finding to incorporate the impact on wetland migration.
We think that such a re-evaluation should find that shore protection has a cumulative environmental impact. The Clean Water Act does not explicitly define the term, but the context implies that an impact need not be large to be considered a `cumulative environmental impact':
The immediate result of recognizing the cumulative impact would be to require property owners to apply for individual permits [16, 18], which could substantially delay permit approval and disrupt the Corps' ability to review other permit applications [17]. To avoid overwhelming the regulatory process, an alternative framework is needed. It might be possible to issue a revised nationwide permit that truly has a minimal cumulative impact, through a combination of shore protection techniques that preserve wetlands [13] and/or requirements to mitigate lost opportunities for wetland migration by facilitating such opportunities elsewhere [19]. A more comprehensive approach would be to consciously manage the impacts of shore protection as sea level rises with estuary-wide plans that define the fates of shorelines as sea level rises [29]. A wide variety of planning and legal mechanisms are available for implementing a planned retreat without hurting property owners [10, 19].
The maps provided by this study can serve as an initial benchmark for evaluating the environmental consequences of the business-as-usual response to sea level rise and possible alternatives that would better preserve the environment and comply with the law. They can also be used to focus efforts on the 30% of low-lying land that is neither developed nor conservation land. Ensuring that some of these lands are abandoned to a rising sea so that ecosystems can adjust would face economic, political, and legal challenges; but defending the entire coast seems even more difficult in the long run [10, 12, 19, 21]. If environmental policies must eventually be revised to ensure that wetlands migrate inland, now is the best time for wetland regulators to update policies to recognize that sea level is rising. It is also a good time for all of us to ask whether this generation should continue to build new communities in vacant land vulnerable to a rising sea.
Acknowledgments
We thank Richard Alley, Virginia Burkett, Vivien Gornitz, Dork Sahagian, and two anonymous reviewers for critical discussions and review of the manuscript; Many Cela, Neal Etre, John Herter, Andrew Hickok, Russ Jones, Gaurav Singha, Richard Streeter, and Kevin Wright for GIS support; and Jeff Alexander, Teresa Concannon, Walter Clark, Peter Johnston, Cheryl Matheny, and Maurice Postal for data collection and expert elicitation. Participants at stakeholder meetings and the federal advisory committee organized to review the US Climate Change Science Program's report on coastal elevations and sensitivity to sea level rise helped us to understand the need to explain our approach based on the input land use data rather than the output likelihood of shore protection. We also thank 160 state and local planners listed in table S1 for explaining key policies and providing data for their respective jurisdictions. During the years 2000–2007, the US Environmental Protection Agency (EPA) provided $2 million in contracts, grants, and salaries to support the research reported in this letter. Accordingly, the US government has a royalty-free license to reproduce this letter. For specific author contributions, see the supplementary material.
References
Contents
Supplementary Methods Discussion
Land Use, Wetlands, and Elevation Data. Table S2 lists the land use and planning data used to implement our general approach. Depending on jurisdiction and data type, those data are maintained and distributed by state, city/county, and regional planning departments or nongovernmental agencies. Most of the data are available in digital format compatible with geographical information systems (GIS). Particular zones with a given land-use type are each represented as polygons. The best data on conservation lands is generally available from different sources than data on the other type of land use. In rural portions of North Carolina and Virginia where local land use maps were unavailable, we either relied on land-cover data based on remote sensing or digitized hand renderings of existing and proposed development drawn on 1:250,000 scale USGS topographic maps. We digitized land use maps from printed comprehensive plans for several rural counties between Maryland and Georgia.The planning departments also provided supplemental data sets (Table S3) and corrections to the published data. Available land use data are often 5-10 years old. The planning departments reviewed our draft maps and provided site-specific map corrections to account for recent and newly approved development in areas otherwise shown as undeveloped or intermediate, flood-prone neighbourhoods where abandonment and conversion to wetlands are planned, and new parks or conservation lands in areas otherwise shown as intermediate.
We obtained wetland polygons from the National Wetlands Inventory [1] for 9 states; the other 5 states provided newer data (Table S6). We used EPA's coastal elevation data set [2] for the 8 Mid-Atlantic States, and the US National Elevation Dataset [3] for other states.
Study Area. Our intended study area was all dry land either within 300 m of the shoreline, or below the nationally available USGS 6-m contour. The actual study area was smaller in three cases (See Table S7): (1) the regional planning councils in Florida, only provided information for lands below the 3-m contour, barrier islands, and lands within 300 m of the shore; (2) some inland counties with small amounts of low land were omitted; and (3) Suffolk County (New York) provided land use data for the 500-year floodplain, which generally extends to about the 4-m contour.
We created an "out of study area" mask using the elevation data and a GIS-buffer along the shoreline to exclude land outside the study area from maps and data tabulations.
Data Flattening. For Pennsylvania and some counties in New York, Georgia, and Florida, we found a single data set that had already subdivided all land into mutually exclusive polygons with attributes corresponding to classifications useful for our analysis. But for most locations, the conservation, land use, and planning data came from different sources; and in some cases the policy-based reclassification also required us to obtain a data set delineating floodplains, preservation easements, or existing infrastructure. "Flattening" the data (i.e. creating a single set of mutually-exclusive polygons that are each associated with one of the land categories) required a process implementing a set of GIS decision rules to carry out the intended classification.
Using ESRI's ArcGIS, we applied the built-in union function to combine each of the data sets and preserve all of the associated attribute data necessary to identify current land use and development plans. Then, using the combined attribute table, we selected the polygons that meet specific criteria and assigned each to a development category. For example, in a typical case, the intermediate category would be assigned to all land that is (a) undeveloped today according to the land use data, (b) expected to be developed according to the land use plan, and (c) not part of a conservation area according to the conservation data set. We generally resolved apparent data conflicts by deferring to the data set with the more restrictive purpose, e.g. if land cover data shows an area to be developed while the conservation layer shows it to be a conservation land, we treat it as conservation land.
Overlay with Elevation and Wetlands Data. For the eight mid-Atlantic states, we used an available interpolation model [4] to quantify the area within each land use category. Except where high resolution elevation data are available, that approach relies on published topographic contours to create an interpolated estimate of the amount of land within a given elevation above spring high water, which is generally 30-100 cm above the zero-elevation reference used for topographic maps. Because that model had not been applied to the other states, we followed the same procedure to derive elevations relative to spring high water from the National Elevation Dataset (4), and directly overlaid these elevation estimates with our land classifications.
Caveats concerning expert elicitation. A task force of the US Environmental Protection Agency (EPA) [5] and others have recommended the use of experts for assessing likelihoods of environmental results when other possible sources of likelihood estimates are unavailable. Recent assessments have used expert panels to subjectively estimate the likelihood of wetland loss [6] and barrier island deterioration [7] at specific locations as sea level rises. Our classification is based on published land use data and existing shore protection policies, rather than subjective assessments (see section 2 of the main text). But our attribution of the likelihood of shore protection associated with those classifications was defined by the planners.
We followed the general approach recommended by the EPA task force [5] to elicit planner assessments of the land that could be classified in each of four categories of likelihood of shore protection: very likely, likely, unlikely, and very unlikely. A key limitation in that approach is that no one has assessed the ability of land use planners to project long-term shore protection. As a result, we can suggest two way of viewing our results:
Error and uncertainty. The accuracy of our analysis is also limited by recent and prospective changes in land use. There are also errors in the planning and elevation data, and discrepancies between the boundaries in the different data sets; but those limitations are unlikely to significantly affect our results.
Our results rely primarily on land use data created at a scale of 1:250,000 or better (i.e. accurate to 125 meters). Although some of that data is too coarse for regulatory decisions, this imprecision has little impact on maps or tabular results at the scale of an entire state; and in most cases localities provided us with better data. A more serious problem is that land use data are usually 5-10 years old. To some extent, the planners provided more recent supplements or site-specific corrections to update the data; but the supplemental data sets were often several years old and site-specific corrections tend to only account for major developments. Thus, the use of land use data almost certainly leads us to underestimate the land that is currently developed and overestimate the area of undeveloped land.
Land use plans understate future development, especially in the rural coastal areas from Georgia to Virginia. In those rural areas, land use plans generally identify future development for the purposes of setting priorities for the provision of roads, water, sewer, schools, and other public facilities. Although these priority growth areas tend to be developed first, nothing prevents other undeveloped areas from becoming developed as well. Therefore, our results for Virginia to Georgia probably understate the amount of intermediate lands while further overstating the amount of land likely to remain undeveloped. In the more urban jurisdictions, by contrast, plans assume total buildout except for parcels where there is a specific impediment to development (e.g. regulation, conservation easement, or existing land use as a park or conservation area).
The standard error of elevation data varies from around 20 cm throughout North Carolina and Maryland's Eastern shore (where high-resolution data was available) to 75 cm throughout most coastal areas south of Delaware Bay, to about 150 cm in most areas north of New Jersey [2]. A comparison of high- and low-resolution data concluded that about half of the error is random and half is systematic, and hence the vertical error of a cumulative distribution function would be about half the vertical error for a specific location [8]. If that result is applicable to our study, our results for the area of land vulnerable to a one-meter rise in sea level (Table S8) are probably accurate to within about 10% in Maryland and North Carolina, a factor of 1.5 along most of the coast, and a factor of 2 in the areas with the worst data [8]. Hence one should be cautious in citing our point estimates for the area of vulnerable land. Nevertheless, these errors are unlikely to have a significant effect on the percentages of land associated with the various land categories (Table 1). As Figures 3 and S1 show, the percentages are not very sensitive to elevation; and there is no evidence that errors in elevation data depend on the density of present or future development.
Finally, gaps in our land use data led us to omit some areas. We excluded inland counties that collectively account for about 1% of the land along the Atlantic Coast within one meter above spring high water (Table S7), and local governments in Florida (as well as one county in New York) declined to provide land use data more than 3 or 4 meters above spring high water. The absence of these data prevents us from providing maps depicting likelihood of shore protection for the excluded areas; but it does not significantly affect our aggregate results because these areas account for such a small portion of the land at risk to sea level rise. Within our study area, data limitations prevented us from classifying about 3% of the (apparently) dry land, including 10% in Virginia and 25% in Massachusetts. Most of that omission resulted from boundary discrepancies between the land use data and the wetlands data that we used to define dry land. Often the land use data do not extend all the way to the wetlands, or the county classified specific locations as wetlands or open water (and hence we did not assign a development classification) but our wetlands data identified the land as dry land. Most of the discrepancies were one or two 30-cm cells wide. This mismatch is unlikely to affect the percentages in Table 1, because the cause of the error was independent of the type of land use. Moreover, much of this land may actually be wetland or open water.
Supplemental References
Contributions of specific authors and other study team members
Manny Cela, Walter F. Clark, Andrew Hickok, and Maurice Postal were full partners in the underlying study and would have been listed as authors but for the author fee. D.L.T. coordinated data collection and analysis for Florida, while D.E.H. coordinated all other states except for the District of Columbia and portions of New York. D.E.H. also prepared figures 1 and 2. J.G.T. designed the study and wrote the manuscript, based on the results of data collection, analysis, and expert elicitation provided by specific authors: Massachusetts (J.F.O. and D.E.H), Rhode Island (J.M.K.), Connecticut (A.H. and D.E.H. ), New York (J.J.T.), New Jersey (M.C., J.M.K., and J.G.T.), Pennsylvania (C.J.L.), Delaware (D.E.H. and J.G.T), Maryland (D.E.H., W.H.N., and J.G.T.), Virginia (C.H.H., J.G.T., and D.E.H), North Carolina (W.F.C., J.M. K., and J.G.T), South Carolina (A.H., D.E.H., and J.G.T.), Georgia (D.E.H.), Northeast Florida (M.P. and D.L.T), East-Central Florida (T.M.M), Treasure Coast, Florida (P.G.M. and M.C) and South Florida (M.C. and J.G.T). J.W. undertook the elevation/planning GIS overlay.
The author fee was split by the authors. The employing institutions listed on the title page paid the shares for Hudgens, O'Connell, Kassakian, Tanski, Linn, Hershner, McCue, Merritt, and Trescott.
Explanation of Supplementary Tables and Figures
Tables S1-S7 provide additional documentation of our study approach. Table S1 lists the (mostly local) planners who provided data and expert judgment on how those data should be interpreted for this study. Tables S2, S3, and S6 list the specific data sources use used. Table S4 and S5 list the policies that we used to classify the data. Table S7 quantifies the area of land excluded from our study area due to data limitations or our decision to omit jurisdictions with very little vulnerable land.
Table S8 and Figure S1 provide estimates of actual areas of land for the various classifications, corresponding to Table 1 and Figure 2, respectively, which provide the same results as percentages of dry land.
Figures S2-S23 are maps that display our results at different locations and different scales. The map colors are the same as Figures 1 and 2. However, because these maps were prepared as part of our collaboration with county planners, they use the likelihood of shore protection category labels (almost certain, likely, unlikely, no shore protection) that we originally employed when we met with the planners, rather than the land-use labels (developed, intermediate, undeveloped, conservation). Because different members of our study team worked on different states, the map formats also exhibit some variation. Most of the Florida maps depict a single county, and include a few major highways or landmarks. The mid-Atlantic maps use dark and light shades to distinguish degree of vulnerability. For a given likelihood category a darker shade signifies land that is either less than 2 meters above spring high water or within 300 meters of the shore, and a lighter shade represents land that is 2 to 5 meters above spring high water and more than 300 meters from the shore. The maps of Georgia and New England also use the two elevation bands, but do not consider distance from the shore. Higher resolution versions of these maps will be available at http://risingsea.net/ERL.
The reader who closely examines these maps may have many site-specific questions about why particular locations are depicted in a certain way. The authors have prepared 13 state-specific reports plus 4 reports for Florida, which explain the study assumptions in great detail for each county. Those reports will hopefully be published in the near future. The status of their availability will also be kept up-to-date at http://risingsea.net/ERL .